- Главная
- Блог
- Об авторе
- Подписка на IT блог
-


- v1.1229
Let's look at: Trace, Profiling, Integration Testing, Code Coverage, Mocking, Deadlock Detection in Go vs Java | Testing, Debugging and Profiling
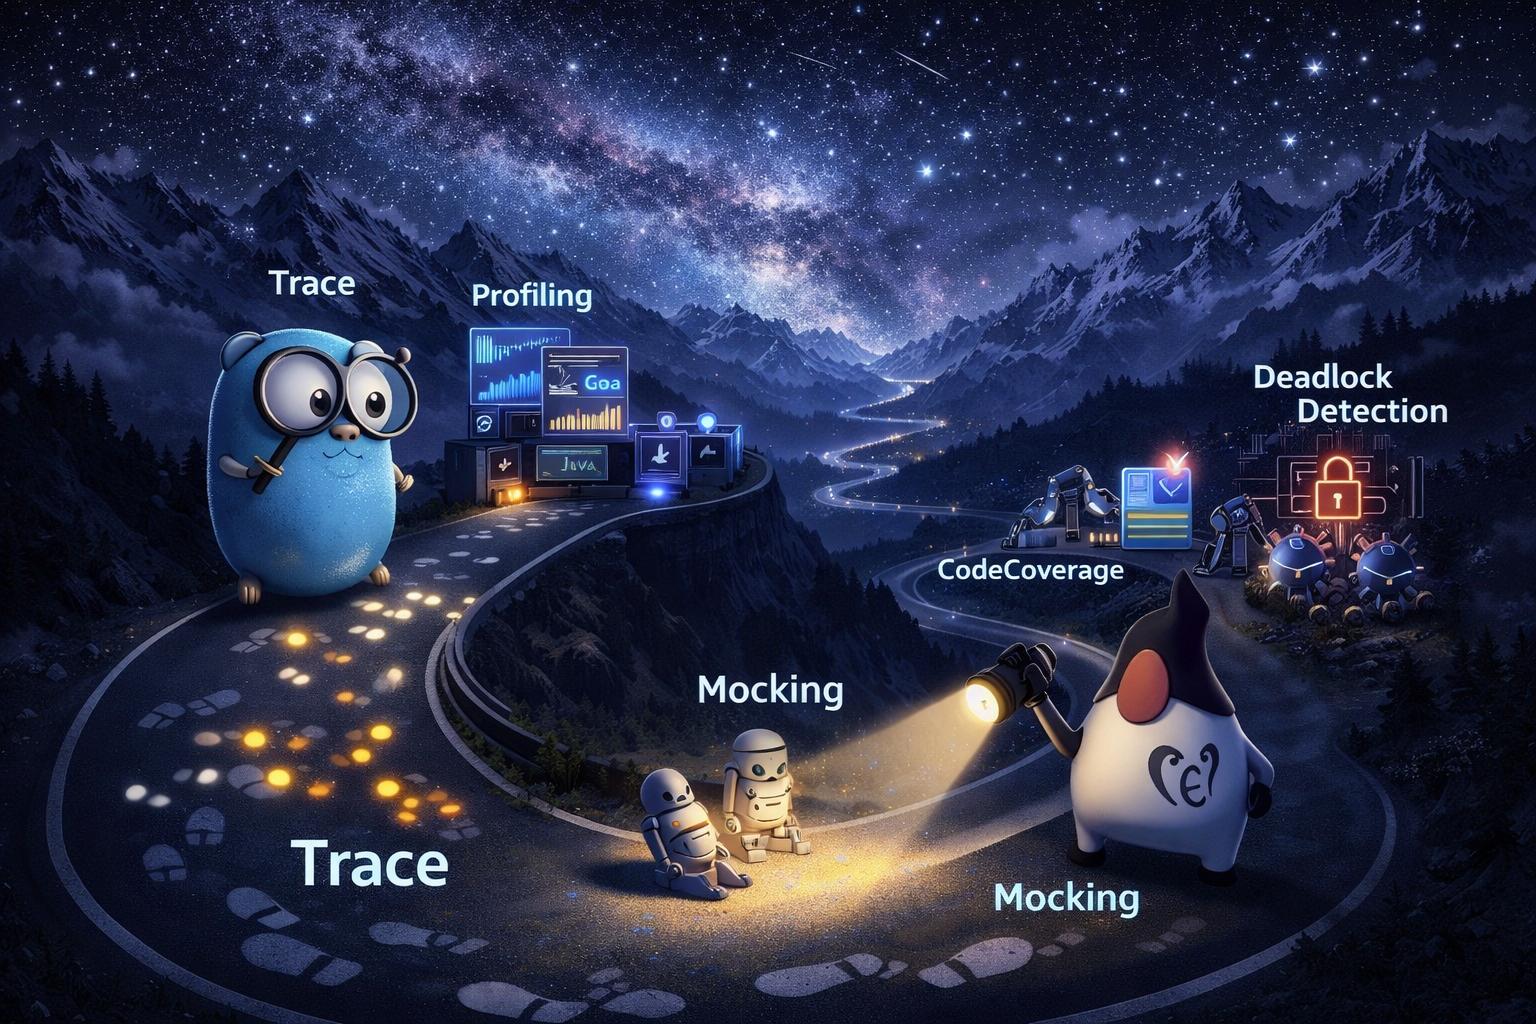
Series: Go for Java Developers — analysis of trace, profiling and testing
In this article we will analyze tools and practices for testing, debugging and profiling in Go. For a Java developer this will make it easy to navigate in Go, and for a Go developer — to compare approaches with Java.
Trace — program execution tracking
Go has a built-in package runtime/trace for detailed program analysis.
Allows tracking goroutine, syscalls and execution time.
Trace example
// Go
import (
    "os"
    "runtime/trace"
    "time"
)

func main() {
    f, _ := os.Create("trace.out")
    defer f.Close()
    trace.Start(f)
    defer trace.Stop()

    time.Sleep(time.Second) // example work
}
Java equivalent: via Flight Recorder or JVisualVM profiler
// Java (example of recording events via Flight Recorder API)
import jdk.jfr.Recording;

public class Main {
    public static void main(String[] args) throws Exception {
        try (Recording recording = new Recording()) {
            recording.start();
            Thread.sleep(1000); // example work
            recording.stop();
            recording.dump(new java.io.File("trace.jfr").toPath());
        }
    }
}
Trace is useful for deep performance analysis and identifying bottlenecks, especially with concurrency.
CPU and memory profiling
Go provides the pprof package for CPU and memory profiling.
This helps optimize resource usage.
CPU profile example
// Go
import (
    "os"
    "runtime/pprof"
)

func main() {
    f, _ := os.Create("cpu.prof")
    defer f.Close()
    pprof.StartCPUProfile(f)
    defer pprof.StopCPUProfile()

    // load
    for i := 0; i < 1000000; i++ {}
}
Java equivalent: JVisualVM profiler or Java Flight Recorder
// Java
// CPU and heap profiling via JVisualVM / Flight Recorder
// Example of profiling manually in Java is not needed, GUI is used
Tip: profile CPU and memory regularly, especially under high loads and multithreading.
Integration Testing — integration tests
Go uses the testing package for unit and integration tests.
Java uses JUnit/TestNG. In Go, tests are written simply and composed via *_test.go files.
Integration test example
// Go
import "testing"

func TestIntegration(t *testing.T) {
    result := 1 + 2
    if result != 3 {
        t.Error("Expected 3")
    }
}
Java equivalent:
// Java
import org.junit.jupiter.api.Test;
import static org.junit.jupiter.api.Assertions.*;

class MainTest {
    @Test
    void testIntegration() {
        assertEquals(3, 1 + 2);
    }
}
Code Coverage — test coverage
Go supports code coverage analysis via go test -cover.
Java — via JaCoCo or built-in IDE tools.
Command example
// Go
go test -cover ./...
Tip: 80%+ coverage is important for stability and confidence in code changes.
Mocking interfaces — dependency substitution
Go allows mocking interfaces manually or via third-party libraries (gomock). Java uses Mockito or PowerMock.
Go example
// Go
type DB interface {
    Get(id int) string
}

type MockDB struct{}

func (m MockDB) Get(id int) string {
    return "mocked"
}
Java equivalent:
// Java
import static org.mockito.Mockito.*;

interface DB {
    String get(int id);
}

public class Test {
    public void test() {
        DB mockDb = mock(DB.class);
        when(mockDb.get(1)).thenReturn("mocked");
    }
}
Deadlock detection — detecting deadlocks
Go race detector (go run -race) helps identify races and deadlocks.
Java — thread dump, VisualVM or built-in IDE tools.
// Go
go run -race main.go
Tip: races and deadlocks are major multithreading issues. Use built-in tools for quick detection.
Comparison table Go ↔ Java
| Concept | Go | Java | Comment |
|---|---|---|---|
| Trace | runtime/trace | Flight Recorder / JVisualVM | Detailed execution analysis |
| CPU / Memory profiling | pprof | JVisualVM / Flight Recorder | Resource usage analysis |
| Integration testing | testing package, *_test.go | JUnit / TestNG | Simple test writing |
| Code coverage | go test -cover | JaCoCo / IDE | Tracking coverage |
| Mocking interfaces | manual or gomock | Mockito / PowerMock | Dependency substitution for tests |
| Deadlock detection | race detector | thread dump / VisualVM | Identifying races and locks |
Practical conclusion
- Go has built-in tools for testing, profiling and debugging — easier to integrate into pipeline.
- Java offers powerful third-party tools and IDE, but requires more setup.
- Race detector and pprof — key tools for safe concurrency work.
- Mocking and coverage are convenient for maintainable and reliable code.
- Comparing approaches Go ↔ Java allows quick adaptation between languages and using best practices.
Оставить комментарий
Полезные статьи:

Новые статьи: